Soil Summary Interactive Map
NRM’s annual soil summary is available as an interactive map. Farmers can drill down into crop type and nutrient summaries for their region and county, delivering more relevant data that is more closely accurate to the farms themselves.
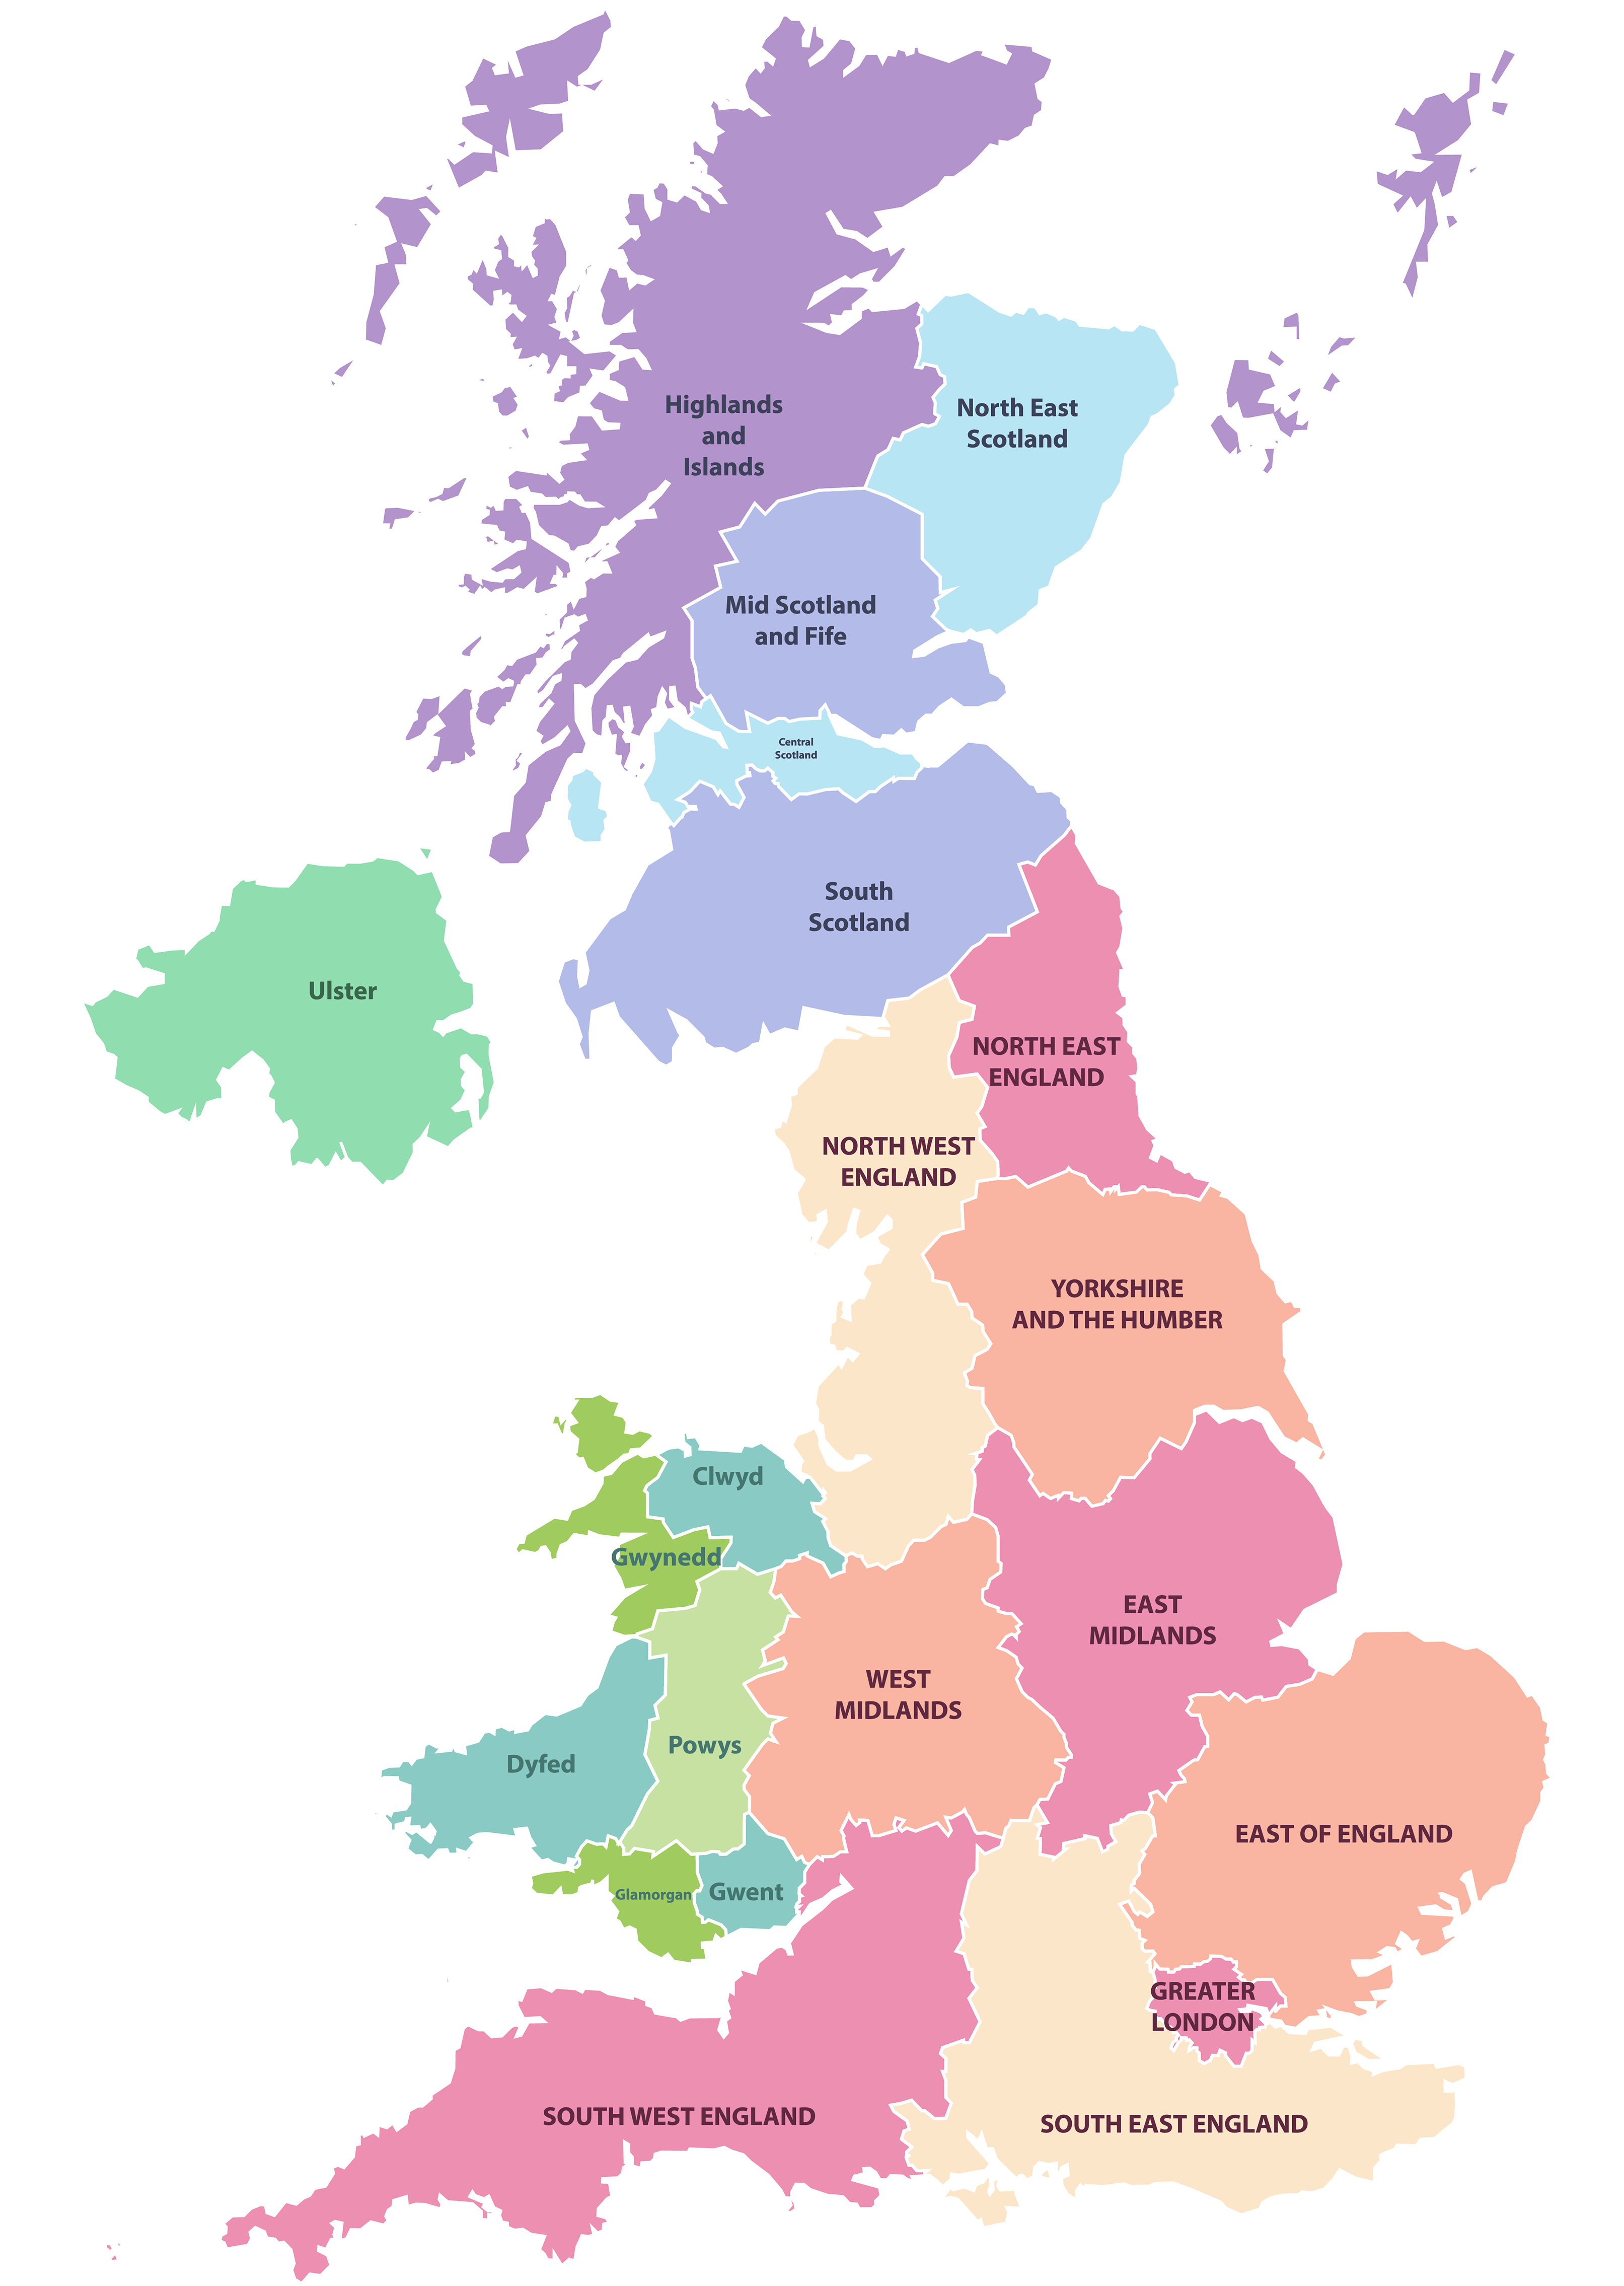
Select a region from the map to drill down into the crop type and nutrient summaries for that region. You can then further localise your summary by county. Our data for phosphorus, potassium and magnesium is split out by arable and grassland and summarised according to the 9th edition of the RB209.
Our 2023-2024 summary includes data from thousands of soil samples from farms across the country collected between June 2023 and May 2024.
For the last 30 years, we have found that two thirds of most soils are deficient in the three key nutrients, and this year was no different. However, there are interesting variations across the UK. For example, while arable soils in Dorset in the South West of England are high in phosphorus and soil pH, those in Worcestershire in the West Midlands are low in phosphorus and middling in soil pH.
Viewing the data this way is more relevant to your farm and your conditions than ever before, helping you to further understand the current nutrients status of your soils and benchmark against other farms.
Please select a region from the map to begin.